
Live solar & grid
See solar production and grid draw in kW right now, plus whether your system is online.
4.8 kW
Solar
1.2 kW
Grid
+3.6 kW
Surplus
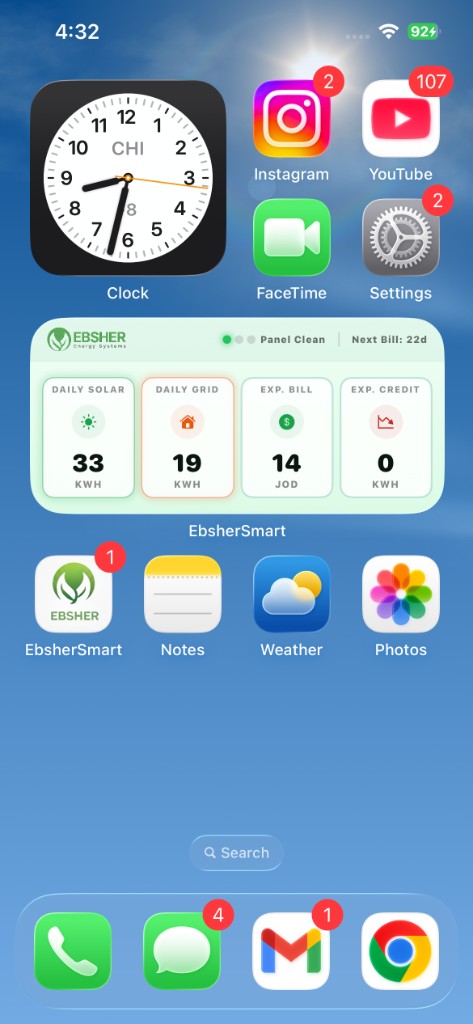
One screen for live solar and grid power, your expected bill, panel health, and the monthly picture — just like the demo below.
Click to interact
Full interactive demo
Try the interactive demo →
Over time, dust blocks sunlight and gradually reduces panel output. Ebsher Smart monitors soiling percentage and tells you exactly when to clean — so you can get back to full production.
See solar production and grid draw in kW right now, plus whether your system is online.
Soiling loss percentage and color cues — know when performance is fine vs when to clean.
Expected bill, current and forecast credit, and days until your next billing cycle.
A chart comparing solar generation vs grid use for your billing month.
Alerts and home-screen widgets — in English and Arabic.
Dashboards, charts, and solar/grid flow visualizations with home screen widgets.
Grid credit, expected bill, and countdown to your next billing cycle — on the Solar & Grid screen.
Soiling insights and cleaning workflows inside the app.
Immediate push notifications when your solar system stops generating or any issue is detected — so you never miss a problem.